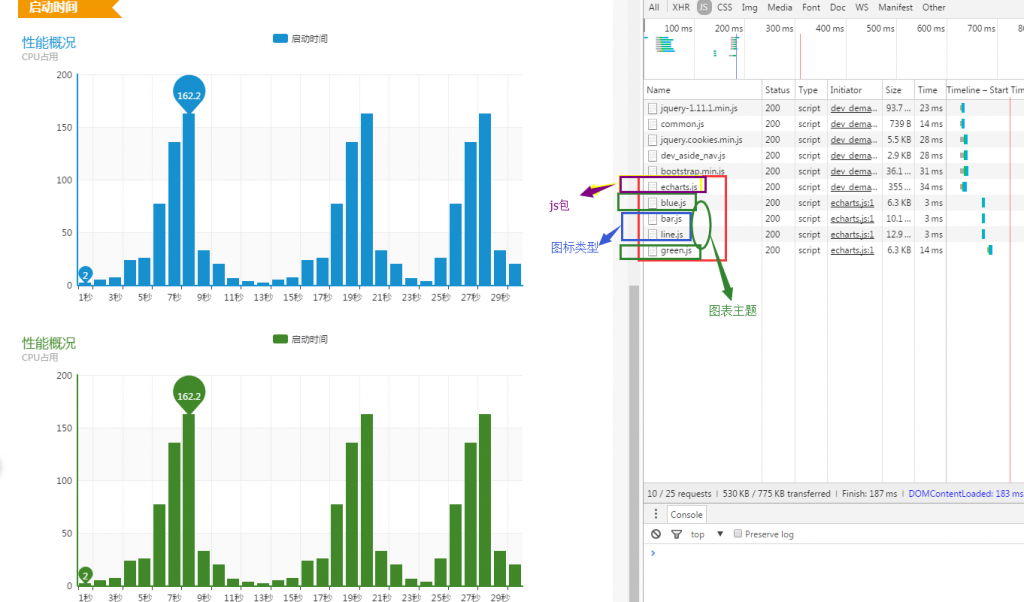
echarts.js多图表数据展示使用小结
echarts api文档:
http://echarts.baidu.com/echarts2/doc/doc.html
echarts demo示例:
http://echarts.baidu.com/echarts2/doc/example.html
echarts 使用五部曲:
1. 制作一个图表容器
<div id="main" style="height:400px;"></div>
2. 引入echarts.js文件
<script src="http://echarts.baidu.com/build/dist/echarts.js"></script>
3. 配置图表路径
require.config({
paths:{echarts:".../dist"
theme: '../echarts/src/theme/',
}
});
4. 加载图表js文件(模块化加载)
require(["echarts",'theme/blue', "echarts/chart/bar"], loadEchart);
5. 绘制图表
function loadEchart(ec,theme) {
var myChart = ec.init(document.getElementById("main"),theme);
var option = { ... }; // 图表配置信息
myChart.setOption(option);
}
参数theme是指定主题,主题需要在第四步引入需要加载的主题。
echarts 同页面多图表使用实例:
<script src="http://localhost/beyondsoft/static/component/echarts/build/dist/echarts.js"></script>
<script type="text/javascript">
// 路径配置
require.config({
paths: {
echarts: 'http://localhost/beyondsoft/static/component/echarts/build/dist/',
theme: 'http://localhost/beyondsoft/static/component/echarts/src/theme/',
theme2: 'http://localhost/beyondsoft/static/component/echarts/src/theme/'
}
});
// 使用
require(
[
'echarts',
'theme/blue',
'echarts/chart/bar', // 使用柱状图就加载bar模块,按需加载
'echarts/chart/line'
],
function(ec,theme) {
// 基于准备好的dom,初始化echarts图表
var myChart = ec.init(document.getElementById( "main"),theme);
// 过渡---------------------
/*myChart.showLoading({
text: '正在努力的读取数据中...', //loading话术
});*/
var option = {
title: {
text: '性能概况',
subtext: 'CPU占用'
},
tooltip: {
trigger: 'axis'
},
legend: {
data: ['启动时间']
},
toolbox: {
show: true
},
calculable: true,
xAxis: [{
type: 'category',
data: ['1秒', '2秒', '3秒', '4秒', '5秒', '6秒', '7秒', '8秒', '9秒', '10秒', '11秒', '12秒','13秒', '14秒', '15秒','16秒', '17秒', '18秒','19秒', '20秒', '21秒', '22秒', '23秒', '24秒', '25秒', '26秒', '27秒', '28秒', '29秒', '30秒']
}],
yAxis: [{
type: 'value'
}],
series: [{
name: '启动时间',
type: 'bar',
data: [2.0, 4.9, 7.0, 23.2, 25.6, 76.7, 135.6, 162.2, 32.6, 20.0, 6.4, 3.3,2.0, 4.9, 7.0, 23.2, 25.6, 76.7, 135.6, 162.2, 32.6, 20.0, 6.4, 3.3, 25.6, 76.7, 135.6, 162.2, 32.6, 20.0, 6.4, 3.3],
markPoint: {
data: [{
type: 'max',
name: '最大值'
}, {
type: 'min',
name: '最小值'
}]
},
}]
};// 为echarts对象加载数据
myChart.setOption(option);
}
);
// 使用
require(
[
'echarts',
'theme2/green',
'echarts/chart/bar', // 使用柱状图就加载bar模块,按需加载
'echarts/chart/line'
],
function(ec2,theme2) {
// 基于准备好的dom,初始化echarts图表
var myChart = ec2.init(document.getElementById( "main2"),theme2);
// 过渡---------------------
/*myChart.showLoading({
text: '正在努力的读取数据中...', //loading话术
});*/
var option = {
title: {
text: '性能概况',
subtext: 'CPU占用'
},
tooltip: {
trigger: 'axis'
},
legend: {
data: ['启动时间']
},
toolbox: {
show: true
},
calculable: true,
xAxis: [{
type: 'category',
data: ['1秒', '2秒', '3秒', '4秒', '5秒', '6秒', '7秒', '8秒', '9秒', '10秒', '11秒', '12秒','13秒', '14秒', '15秒','16秒', '17秒', '18秒','19秒', '20秒', '21秒', '22秒', '23秒', '24秒', '25秒', '26秒', '27秒', '28秒', '29秒', '30秒']
}],
yAxis: [{
type: 'value'
}],
series: [{
name: '启动时间',
type: 'bar',
data: [2.0, 4.9, 7.0, 23.2, 25.6, 76.7, 135.6, 162.2, 32.6, 20.0, 6.4, 3.3,2.0, 4.9, 7.0, 23.2, 25.6, 76.7, 135.6, 162.2, 32.6, 20.0, 6.4, 3.3, 25.6, 76.7, 135.6, 162.2, 32.6, 20.0, 6.4, 3.3],
markPoint: {
data: [{
type: 'max',
name: '最大值'
}, {
type: 'min',
name: '最小值'
}]
},
}]
};// 为echarts对象加载数据
myChart.setOption(option);
});
</script>

